About Chartist - Technical Analysis
If a picture is worth a thousand words, then a chart can include more than a million data points. And hence is much more useful to convey technical analysis and your thoughts. Chartist is a simple application for people...
If a picture is worth a thousand words, then a chart can include more than a million data points. And hence is much more useful to convey technical analysis and your thoughts. Chartist is a simple application for people interested in following indian markets that allows you to check and see chart patterns being formed on daily and weekly basis.
Major Exchanges -
1. National Stock Exchange (NSE)
2. Bombay Stock Exchange (BSE)
You must have a little bit of background on technical analysis. Or you may prefer to learn on the way. Once you get a feel, you will start seeing a pattern being formed. Please use the drawings to mark those patterns and save the charts for your future reference and also for others to see. At the same time you can view other's analysis and chart patterns of leading stocks and indexes, and mark them your favourite.
HOW IT WORKS?
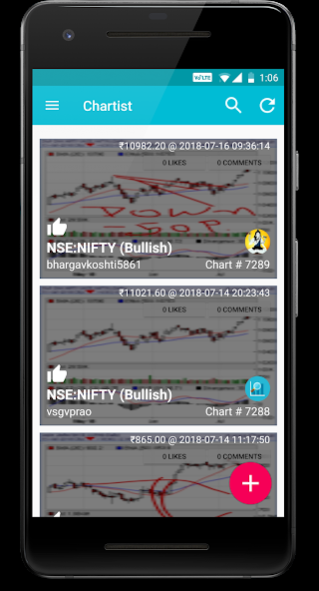
1. You can view charts of more than 6000+ STOCKS and INDEXES.
2. You can draw on the charts with free hand and save it for future reference.
3. You can learn from others doing the same and save their technical analysis as your favorites.
TECHNICAL CHART PATTERNS INCLUDED
The following is an exhaustive list of basic chart patterns that the application supports at the moment -
Reversal - Double Top,Reversal - Double Bottom,Reversal - Head and Shoulders Top,Reversal - Head and Shoulders Bottom,Reversal - Falling Wedge,Reversal - Rising Wedge,Reversal - Rounding Bottom,Reversal - Triple Top,Reversal - Triple Bottom,Reversal - Bump and Run,Continuation - Flag, Pennant,Continuation - Symmetrical Triangle,Continuation - Ascending Triangle,Continuation - Descending Triangle,Continuation - Rectangle,Continuation - Price Channel,Continuation - Measured Move ~Bullish,Continuation - Measured Move ~Bearish,Continuation - Cup with Handle
CHART TYPES
1. Candlestick
2. Lines
3. OHLC
TECHNICAL INDICATORS SUPPORTED
UPPER INDICATORS
Simple Moving Average,Exponential Moving Average,Weighted Moving Average,Triangular Moving Average,Bollinger Bands,Donchian Channel,Envelop (SMA 20 +/- 10%),Parabolic Sar
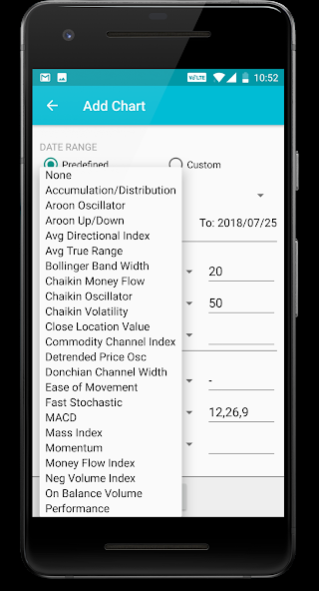
LOWER INDICATORS
Accumulation/Distribution,Aroon Oscillator,Aroon Up/Down,Avg Directional Index,Avg True Range,Bollinger Band Width,Chaikin Money Flow,Chaikin, Oscillator,Chaikin Volatility,Close Location Value,Commodity Channel Index,Detrended Price Osc,Donchian Channel Width,Ease of Movement,Fast Stochastic,MACD,Mass Index,Momentum,Money Flow Index,Neg Volume Index,On Balance Volume,Performance,% Price Oscillator,% Volume Oscillator,Pos Volume Index,Price,Volume Trend,Rate of Change,RSI,Slow Stochastic,StochRSI,TRIX,Ultimate Oscillator,Volume,William's %R
Although, this is a pretty exhaustive list, we intend to support more and more chart patterns and technical tools in future. Feel free to suggest and we will be quick to incorporate.
DISCLAIMER: Users of Chartist are supposed to be beginners in finding chart patterns following technical analysis. Their analysis and opinion conveyed are personal. This must not be used for recommendations. Also, we cannot be held responsible for any resulting loss from inaccuracies or via any other means. All information provided via Chartist must be used for information purpose only and not as investment/financial/research advice.
WE CONNECT YOU TO THE WORLD OF TECHNICAL ANALYSIS! DO CARE TO CONNECT WITH US?
Facebook: https://facebook.com/speculometer
Twitter: http://twitter.com/speculometer
eMail:
[email protected]
Website: http://www.speculometer.com
SPECULOMETER :-)
Previous Versions
Here you can find the changelog of Chartist - Technical Analysis since it was posted on our website on 2016-12-22 13:51:21.
The latest version is 93.0.0 and it was updated on 2024-04-22 15:27:42. See below the changes in each version.
Chartist - Technical Analysis version 93.0.0
Updated At: 2019-09-04
Changes: Chartist connects to Kite - Zerodha's trading platform.
Chartist - Technical Analysis version 64
Updated At: 2016-08-20
Changes: - Follow,Private,New Design!,- Introducing intraday live charts for NSE/BSE/MCX,- Magnifing glass to view charts better,- Added 2 more indicators ~ PVT & Chaikin Oscillator,- Added notification on chart comment - optimized,- Now trade directly on charts via Zerodha,- Added module for learning technical analysis - daily tips,- Added thumbnails for faster uploads,- Added alerts for custom stock targets,- Added tinder style sentminent recorder,- Added notification alerts for possible chart patterns
Disclaimer
Official Google Play Link
We do not host Chartist - Technical Analysis on our servers. We did not scan it for viruses, adware, spyware or other type of malware. This app is hosted by Google and passed their terms and conditions to be listed there. We recommend caution when installing it.
The Google Play link for Chartist - Technical Analysis is provided to you by apps112.com without any warranties, representations or guarantees of any kind, so access it at your own risk.
If you have questions regarding this particular app contact the publisher directly. For questions about the functionalities of apps112.com contact us.